Jeff's Flow Garden
My dataviz entry to ThousandEyes' Hackday 2023
Winner of the Tech Innovation Award at ThousandEyes Hackday 2023

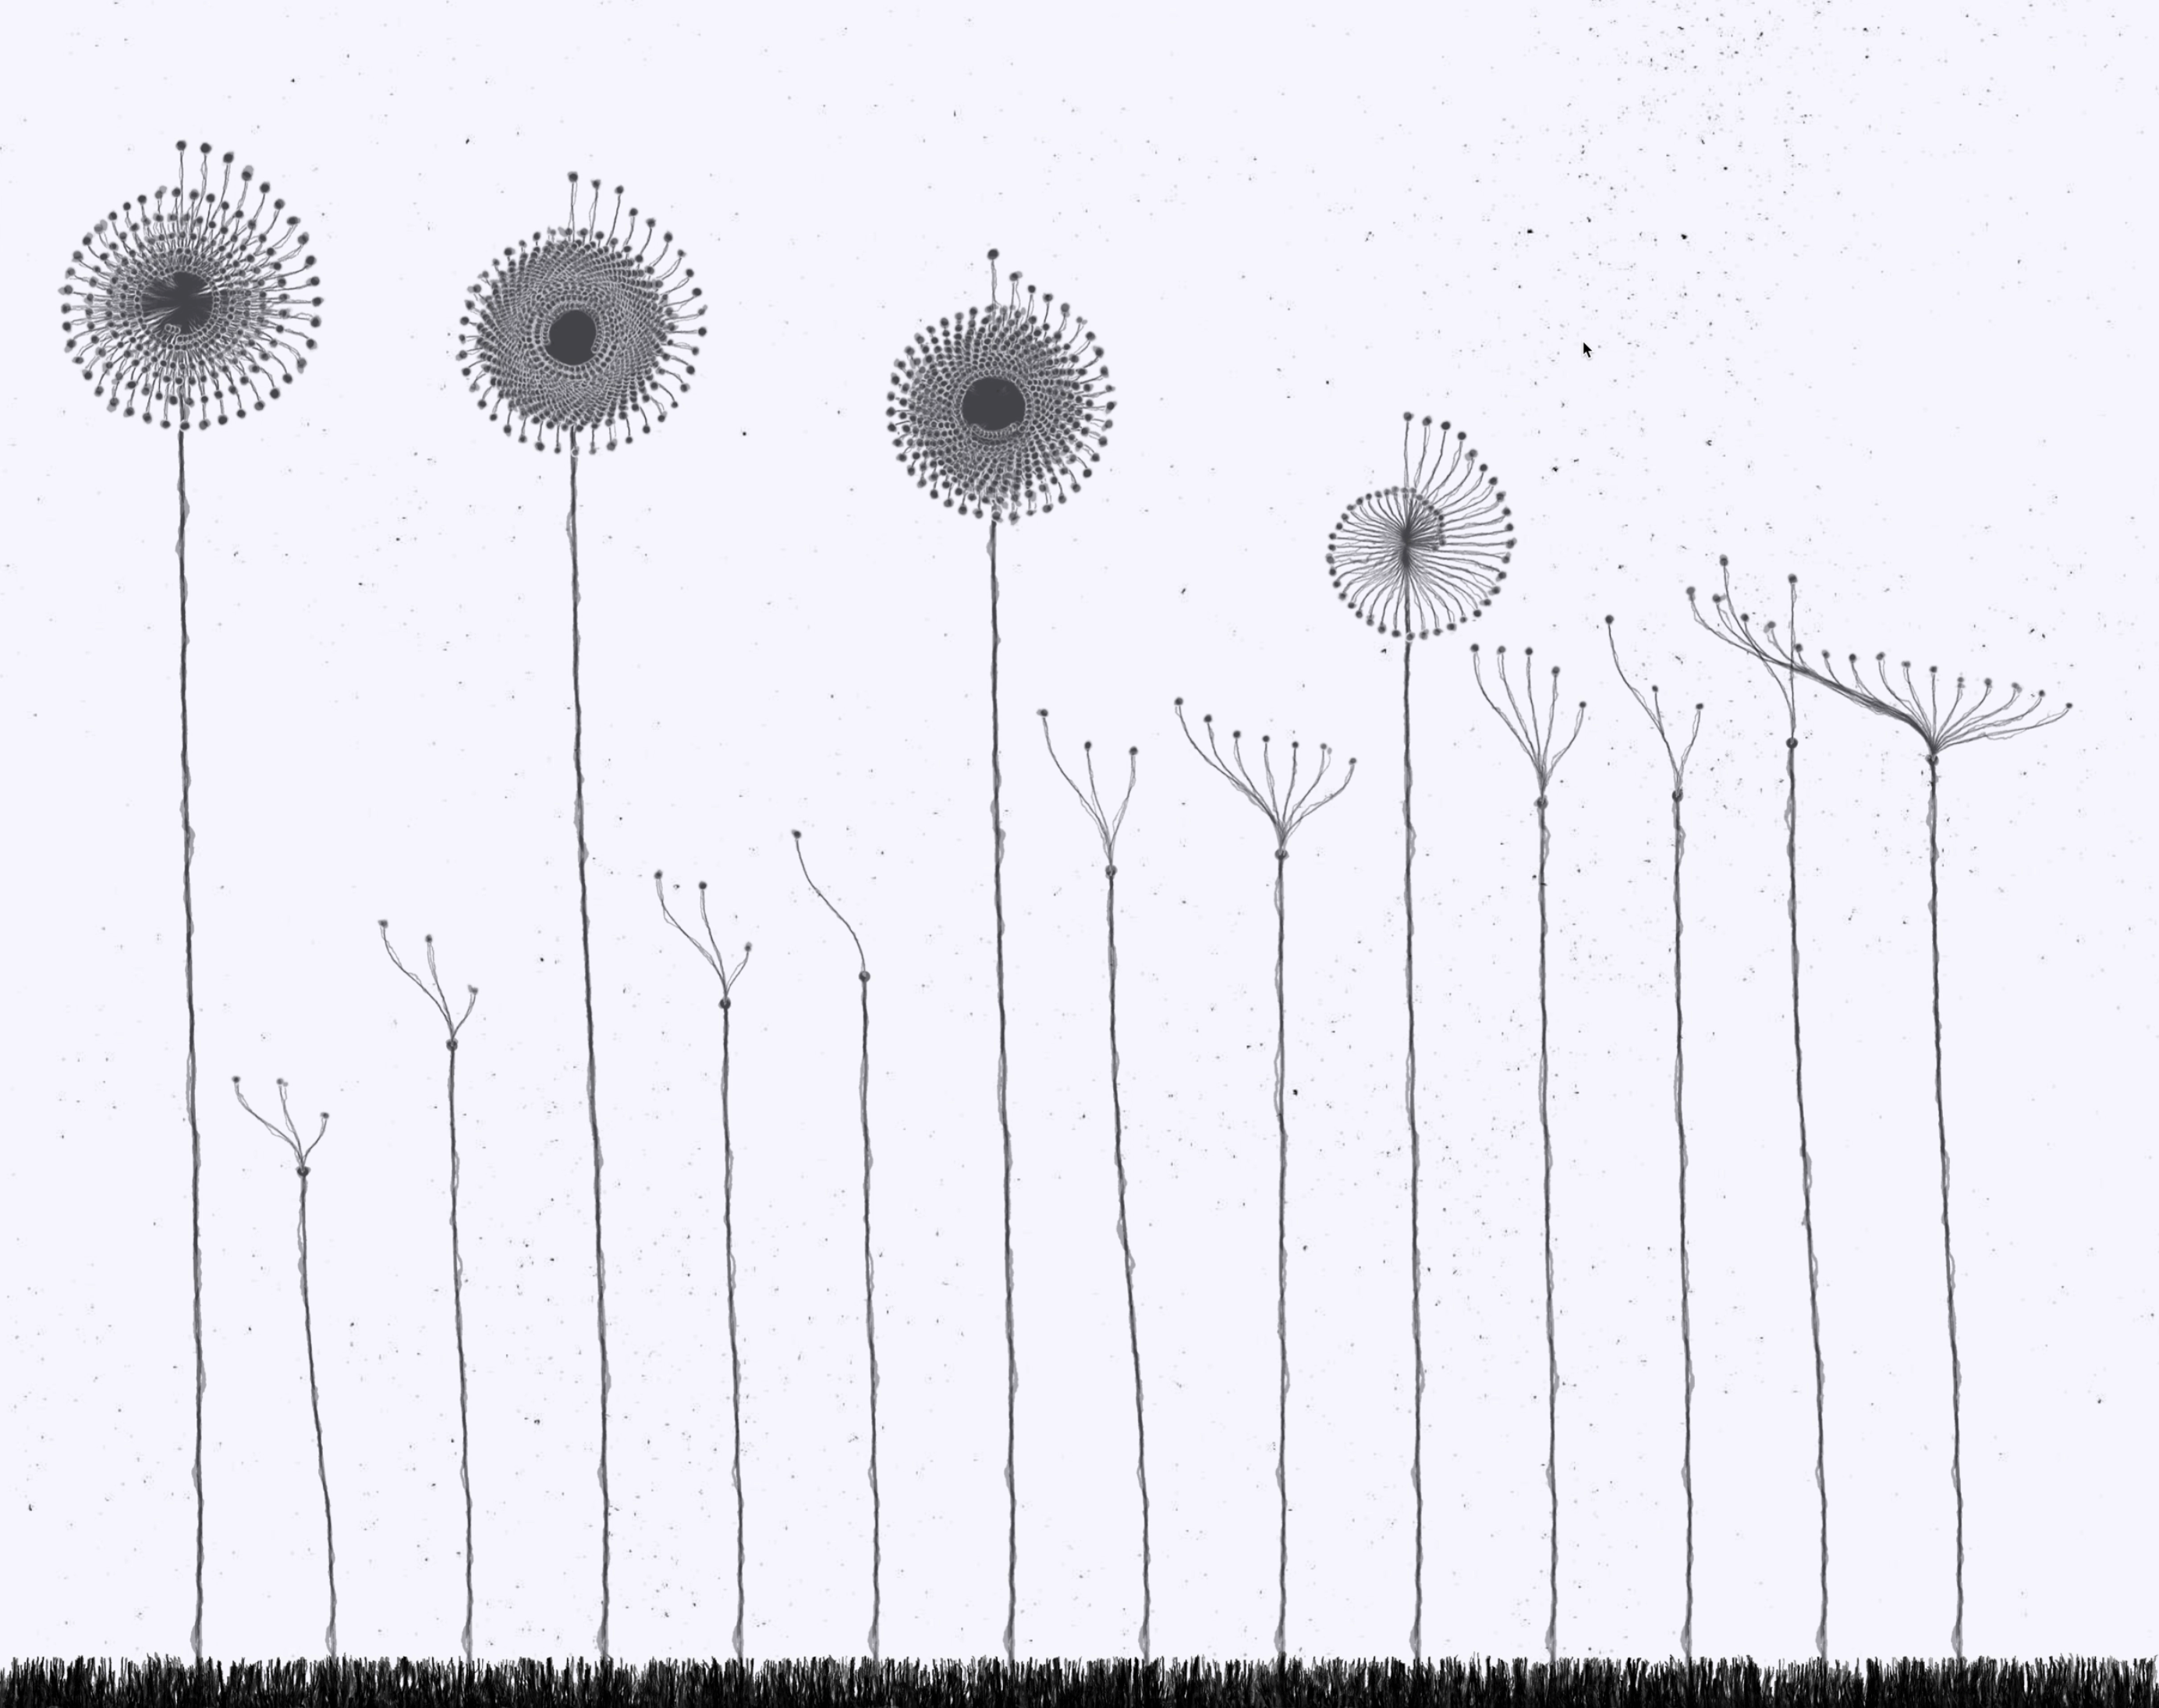
My team and I wanted to find a different way to visualize the millions of network flows analyzed by our spoofing detection software every minute. All the flows are analyzed and categorized into classes (the type of device, e.g., Printers, Game Consoles, etc.) and device models. Spoofing detection is a very complex process, but the goal here was simply to represent the volume of data we process every minute and illustrate the proportions between the different classes.
Since this wasn't a customer-facing project but just an experiment, I decided to build a romantic story around it: Jeff is a bot who lives in the cloud and spends his days observing network flow data. He also loves nature, Victorian-era imagery, and drawing. Combining these elements, I decided to represent classes as trees, with their height corresponding to the number of flows, and devices as branches. Each branch's length represents the number of flows for that specific device, while the size of the leaf on top reflects the number of endpoints for that device. Since Jeff loves to draw but, being a bot, has never actually seen a tree, I aimed to give the chart a deliberately clumsy, hand-drawn feel. I also made it dark and gothic to align with the Victorian-era gothic aesthetic.
But why the name Jeff? The name is inspired by Hitchcock's Rear Window, a movie in which the main character spends his days at the window, observing the lives of his neighbors.
The UI for this project was developed using VanillaJS. The charts are rendered in SVG with D3JS, and the hand-drawn effect is applied to the clean SVG shapes using a custom, handmade SVG filter.